Voltar
ABOVE AND BELOWGROUND ORGANIC MATTER AND ROOT:SHOOT
RATIO IN A CERRADO IN CENTRAL BRAZIL
Guilherme C. Abdala1, Linda S. Caldas2, M. Haridasan1
& George Eiten2
1Departamento de Ecologia and 2Departamento de Botânica,
Universidade de Brasília, Brasília, DF.
Brazil
--------------------------------------------------------------------------------
ABSTRACT
The aboveground and belowground biomass
and soil carbon were measured to a depth of 6 m in a typical
cerrado (sense strict) located near Brasília, DF,
Brazil, on a well drained dark red latosol (Haplutox).
A phytosociological survey of tree and shrub species,
as well as ground-layer vegetation, was carried out. There
were 3,300 trees and shrubs per hectare, with a total
basal area of 14.5m2 ha-1, cylindrical volume of 68.4m3
ha-1, and aboveground biomass of 26,020kg.ha-1. The ground-layer
presented an average aboveground biomass of 5,580kg.ha-1
(4,130kg.ha-1 grasses and 1,450kg.ha-1 non-grasses). The
litter was estimated at 5,190kg.ha-1. The underground
biomass was estimated at 41,100kg.ha-1, with root crowns
contributing 7,800kg.ha-1, and charcoal an additional
1,980 kg.ha-1. The soil organic matter, to a depth of
620cm, was 642,000kg.ha-1, representing 89% of the total
organic matter, not including charcoal (724,400kg.ha-1).
Key words: biomass; charcoal; global carbon cycle; savanna;
soil organic carbon.
--------------------------------------------------------------------------------
INTRODUÇÃO
Cerrado vegetation covers approximately
2,000,000km2, 20% of the area of Brazil, in its various
physiognomic forms (12). The most widespread is cerrado
savanna with a significant woody-layer component. Although
some studies have been carried out on the aboveground
biomass of the cerrado (37, 39), the only information
available on the root systems of natural communities is
descriptive, with accounts of roots reaching a depth of
18m in the "camp cerrado" of São Paulo
State (32). Because of its extensive area, data on this
ecosystem are needed for studies of productivity, energy
analysis and contributions of management practices to
global carbon cycling.
The occurrence of fire (8), the infertility
of the soils (17, 24) and seasonal stress in the upper
layer of the soil (28) suggest that the belowground component
represents the larger part of the total biomass of cerrado
vegetation. These results are in accordance with the theories
on acquisition and stocking of resources (5). These theories
predict that plants, depending on species and the severity
of stress, tend to allocate more energy to the roots in
order to reduce water and nutritional stress and as a
guarantee in the case of catastrophes such as fire.
The relative lack of information on the
belowground biomass in many ecosystems is due to the difficulty
of removing the soil, a very laborious and expensive process
(45). Exists yet the difficulty of separation and washing
of the roots, rootlets and micro-rootlets, which are distributed
throughout the soil volume. Emphasis on roots in the soil
surface (0 - 100cm) is to be expected given the role of
organic-enriched layers in water entry and storage. It
is observed in retention and mineralization of nutrients,
returned in plant litter and in initial establishment
of non-epiphytic species (41). The root biomass data reported
in the literature for tropical ecosystems seldom exceeds
depths of 2m, with the exception (30) in eastern Amazonian,
who present quantitative data on biomass of roots to 6m
depth.
Two methods are widely used in studies
of root biomass in different ecosystems: excavation of
the root systems of individual plants and extraction of
soil samples of known volume. The first, which is extremely
laborious for large plants, is applicable in studies at
the species level, for determination of the structure
and distribution of roots and the root/shoot ratio. On
the other hand, the method of soil samples measures the
composite root mass (19) and is more widely applicable,
less destructive and provides data on the root/shoot ratio
for the ecosystem as a whole.
The objective of the present study was
to determine the above-and belowground biomass, as well
as soil organic carbon, in a typical cerrado in Central
Brazil, as a basis for further studies.
STUDY AREA
The field studies were carried out from
September 1992 to March 1993, in an area of approximately
20 ha of typical cerrado vegetation near Brasília,
DF. (47o48’45"W, 15o47’30"S) at
an altitude of 1,080m. The climate of the region is characterized
as Cwa, following the classification of Köppen, with
two distinct seasons: a rainy season in the summer and
a dry winter. The average annual precipitation is approximately
1,500mm, with 80% falling between December and March.
Representative water balances for the region register
a water deficit in the soil from June to October. The
average annual temperature is 21oC; the difference between
the average temperature of the coldest month (July) and
the warmest month (September) is approximately 4oC.
The study area has been floristically
and physiognomically well conserved in spite of its proximity
to urban residential area in Brasília, DF. It had
suffered the effects of erosion from road construction
30 years earlier, which led to the formation of two deep
gullies, up to 15m wide and 8m deep. Further erosion had
recently cut and broadened these gullies, which had natural
vegetation growing up to their margins. The experimental
plots were located on both sides of one of these gullies,
within an area of 2ha.
MATERIAL AND METHODS
Phytosociology
Two 20m x 50m plots were marked, one
on each side of the gully, within 10m of the edge, in
areas where the vegetation was typical of the plots which
were excavated for belowground biomass. In each plot,
all woody individuals with circumferences larger than
6.0cm at 30cm up the trunk from the soil level (C30) were
identified to species, and circumference (C30) and oblique
height (from the soil level accomplishing along the curving
trunk to the base of the crown. It came from there vertically
through the crown up to the level of the heights point)
were
measured. The Wisconsin importance percentage
of each species was calculated (11). The principal genera
of theground layer vegetation were determined based on
frequency measurements by the line intercept method of
Cox (9) within 40m on each side of the gully.
Based on the distribution of the number
of woody-layer individuals in circumference classes, the
quotient "q" (obtained by dividing the number
of individuals in a class by the number in the previous
class) was obtained (27). This expresses the percent of
individuals, which are recruited from a class to the immediately
superior. A community is considered "balanced"
when "q" is more or less constant along the
distribution.
Aboveground Biomass
The aboveground biomass of each woody-individual
in the two 20m x 50m plots was estimated from an allometric
equation, obtained from data of 112 cerrado trees and
shrubs (G. Eiten & G.C. Abdala, unpublished). In which
the cylindrical volume calculated as the product of the
basal area at C30 and the oblique height, are used as
the independent variable. The equation is as follows:
Log (y) = 0.9967 log (x) + 2.587 (r =
0.91, P << 0.001)
Where y = total dry weight of the individual
(g) and x = cylindrical volume (dm3).
The aboveground biomass of the ground
layer, including the woody plants with circumference less
than 6cm at 30cm height, was determined in 35 plots measuring
1m x 1m. In these plots, all standing biomass, including
dead material, was cut at the soil level, separated into
grasses and non-grasses, and dried at 70,167ºC. These
samples were taken in September 1992, at the end of the
dry season, and March 1993, near the end of the rainy
season. The distribution of the sample plots was semi-random,
with 7 samples taken near the edges of the gully and 28
at distances varying from 4 to 16m from the edges. No
distinction was made between plots beneath the crowns
of the trees and those in more open situations, although
none of the plots were within 1.5m of the trunks of trees
whose circumference was more than 30cm at 30cm height.
Litter was also collected from these sample plots; fallen
branches and trunks with circumference greater than 6cm
were not included.
Belowground Biomass
Two types of excavations, blocks and
tanks, were made, differing in depth of sampling, volume
of soil collected and treatment applied to the samples.
Soil blocks, or monoliths, of known volume
were collected at different depths, with average dimensions
of 21dm3 (30cm x 35cm surface area x 15-20cm depth), by
manually cutting out the soil sample. Each sample volume
was measured exactly after extraction, based on the dimensions
of the resulting hole. Roots remaining after removal of
the soil were cut and added to the sample. Blocks were
thus collected at 16 different points, always starting
within a 1m x 1m plot in which the aboveground biomass
of the ground layer had been harvested. Seven of these
sites were located on the edges of the gully and 9 at
a distance of 4 to 16m from the edges. In the case of
sampling at the edges of the gully, the samples were taken
at least 200 cm from the edge to a maximum depth of 620cm.
The other, internal plots were sampled to a depth of 100cm.
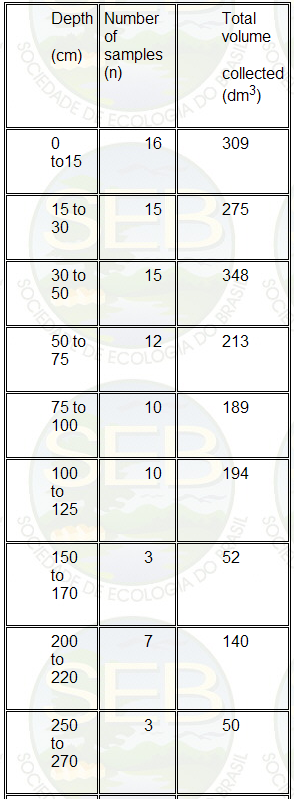
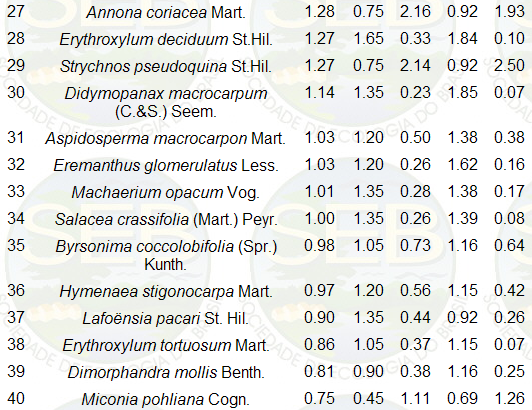
The number of blocks sampled at each depth and the total
volume of soil sampled are presented in Table 1.
Table 1. Number of blocks sampled and the total volume
of soil collected for subsamples A1 + A2 at different
depths.
The soil from each block was sieved through
a wire screen (2mm mesh) in the field. The entire root
and xylopodium segments retained on the screen were collected
as sub-sample A1. The finer material which passed through
the screen was homogenized and a sub-sample of 2dm3 (2
liters) was collected as sub-sample A2. From the soil
remaining after sieving, small samples were taken for
chemical analysis.
Sub-sample A1 was washed in the laboratory.
The roots and detritus from sub-sample A2 were extracted
by agitating the soil sample in a large volume of water
for 20 min and collecting the floating material on a fine
nylon sieve with 0.5mm mesh. No separation was made between
roots of woody and non-woody plants, nor of living and
dead material.
Washed roots were dried at 80oC. Roots
from sub-samples A1 were separated into three size classes
before weighing fine, diameter less than 2mm; medium,
diameter between 2 and 10mm; and thick, diameter greater
than 10mm. Large fragments of charcoal (> than 2mm)
encountered in the samples were weighed separately, as
well as the rhizomes of grasses found in the most superficial
soil samples. The material from sub-samples A2 was classified
as very fine. The proportion between the volume of the
sub-sample taken to the laboratory and the total volume
of the sample in the field was used to estimate the total
biomass of this fraction in the sample. Due to the difficulty
of separating charcoal fragments in some fine and very
fine sub-samples, a visual estimate was made of the minimal
percentage, which the charcoal represented with respect
to the mass of the roots.
Tanks: In order to determine the biomass
of the root crowns of the trees, two excavations of this
type were carried out. Each plot, selected to include
a relatively large number of medium-sized and tall trees,
measured 5m x 20m. The aboveground biomass of the trees
and shrubs was determined and the root crowns and roots
with diameters greater than 10mm were collected, to a
depth of 100cm. All the material was weighed in the field
and sub-samples taken for drying in the laboratory. The
weights obtained were compared with the results of the
equation, which relates the weight of the root crown,
whose roots were cut off at the base, to the basal area
at 30cm height (1):
Y = 0.0688 x + 1.385 (n = 84, r = 0.81,
P << 0.001)
Where y = dry weight of root crown without
roots (kg) and x = basal area (cm2)
Soil organic material: The percentage
of soil organic carbon in the samples collected at different
depths was determined by the method of Allison (2). The
constant 1,724 to convert to percentage of organic material
multiplied this value. The weight of organic material
per volume of soil was calculated from the bulk density
(g.cm-3) measured at different depths from 34 cylindrical
samples of 132cm3, dried at 105oC.
RESULTS
Vegetation
The physiognomy of the area was a typical
cerrado sense strict, with tree crown coverage of 35%.
In the two 1,000m2 plots, 71 species were identified with
circumference at 30cm height (C30) greater than or equal
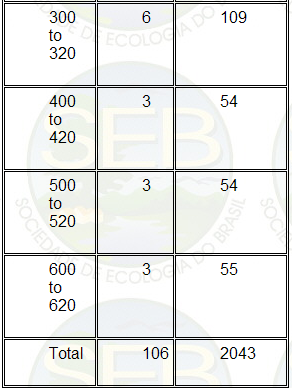
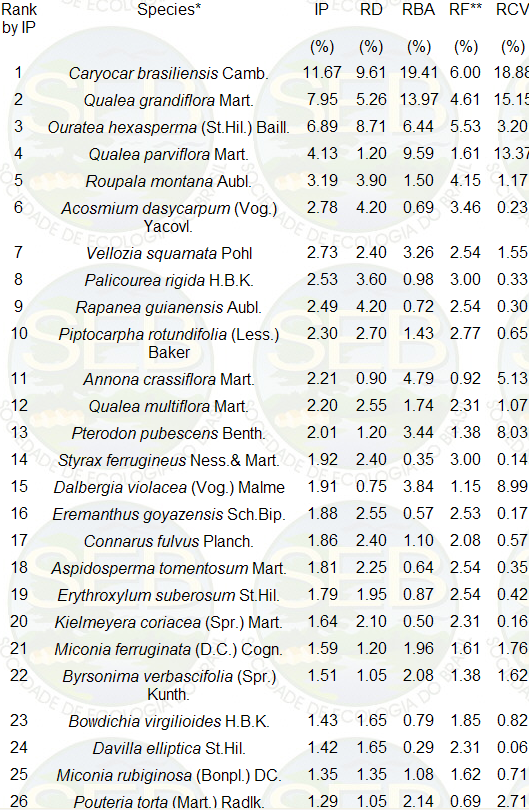
to 6cm. The 40 principal species, based on Importance
Percentage (IP), are listed in Table 2, and are in accordance
with the composition of other areas in the Federal District.
The first three species, Caryocar brasiliensis, Qualea
grandiflora and Ouratea hexasperma, make up 26% of the
total IP, although they represent only 4% of the species,
whereas the 20 species of lowest IP, representing 27%
of the total number of species, make up 4% of the total
IP. The species ranked in positions 1, 2, 4, 13 and 15
(Caryocar brasiliensis, Qualea grandiflora, Qualea parviflora,
Pterodon pubescens and Dalbergia violacea, respectively),
which are the five species with the largest cylindrical
volumes, make up more than 64% of the total cylindrical
volume. The tallest tree in the area was an individual
of Dalbergia violacea, measuring 12m, and the greatest
circumference was that of Pterodon pubescens, measuring
106cm.
Table 2. Wisconsin importance percentage
(IP) of the 40 principal species whose circumference at
30cm height was greater than 6cm. IP = (RD + RBA + RF)
/3, where RD is relative dominance; RBA, relative basal
area; RF, relative frequency and RCV, relative cylindrical
volume (oblique height x basal area at 30cm up). Dead
standing trees not included
* In the Federal District, certain botanists use other
names for some of the species listed above: Orate castaneifolia
for O. hexasperma, Vellozia flavicans for V. squamata,
Styrax ferruginea for S. ferrugineus, Dalbergia miscolobium
for D. violacea.
** For calculating absolute frequency (AF) of each species,
the individuals were listed in the order in which they
were encountered in the field (zigzag), then the list
was sub-divided into groups of 20 neighboring individuals.
The relative frequency (RF) was calculated as RF = 100
AF / S AF.
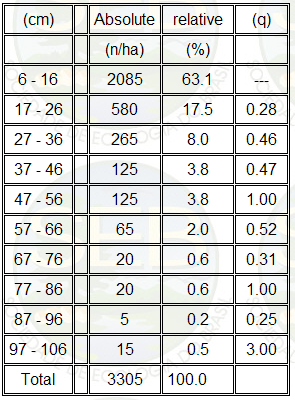
An average of 3,300 individuals with
circumference greater than or equal to 6cm at 30cm height
were found per hectare, with a total basal area of 14.5m2
ha-1 and a total cylindrical volume of 68.4 m3 ha-1. The
frequency distribution of circumference is shown in Table
3. More than 65% of the individuals were less than 2m
tall and more than 85% of the individuals were less than
26cm in circumference. If its is accept the definition
of trees as individuals with a circumference greater than
10cm at 30cm height and at least 3m tall, the average
density of trees in this area was 670ha-1, with the remaining
80% of the individuals belonging to the shrub layer. The
trees in this class belong to 39 species.
The large variation in the "q"
values shown in Table 3 shows that the sampled cerrado
does not have a balanced recruitment in the percent of
individuals that survive into the next greater circumference
class (27). But the backward "J" shape of the
values for absolute number of individuals per class in
Table 3 suggests a tendency to equilibrium.
Table 3. Number of trees plus shrub elements per circumference
class (at 30cm height above ground, C30) per hectare of
the cerrado sense strict. The ratio q = number of individuals
in class n / number of individuals in class n-1.
The standing dead represented 7.5% of
the total stems (live + dead), 2.1% of the total basal
area and 0.4% of the cylindrical volume, indicating that
the majority of the dead stems are in the smaller size
classes.
In the ground layer, the most frequent
genera were Echinolaena, Axonopus, Eragrostis, Trachypogon
and Schizachyrium among the grasses; Croton, Merremia,
Oxalis, Serjania, Maprounea and Pavonia among the non-grasses.
Sprouts of some tree species, such as Dalbergia, Roupala,
Davilla, Ouratea and Rapanea, were also present in the
ground layer. Ground layer real cover was 95%, with Echinolaena
inflexa (Poiret) Chase responsible for more than 70% of
the total cover. Axonopus barbigerus (Kunth) Hitchc. was
another important grass in terms of ground cover. The
non-grasses are negligible in terms of ground cover, contributing
less than 5%. The African grass weed Melinis minutiflora
Beauv. was present sporadically in the area and was not
sampled for biomass measurements.
Aboveground Biomass and Litter
Applying the regression equation of G.
Eiten & G. C. Abdala (unpublished) to the values of
cylindrical volume found in
the 2000m2 area, a total aboveground
biomass of 26020kg. ha-1 was estimated for the woody component
with circumference greater than 6cm at 30cm height (6C30).
Of this total 12% was composed of shrubs and the rest
of trees, as defined above. The leaves made up an estimated
9.7% of the total biomass of the shrubs and 5.2% of the
trees. The biomass of the standing dead was estimated
at 300kg ha-1.
The average standing dry biomass of the
ground layer was 5,580 (+2240)kg.ha-1, with the grasses
representing 4,130 (+500)kg.ha-1. The average biomass
of the litter was 5190 (+190) kg. ha-1.
Belowground Biomass
By correlating the median depth (in cm)
of each of the 106 soil blocks collected with the biomass
of the roots per unit volume (mg cm-3), a regression curve
was obtained (Figure 1). The correlation between the variables
was high, in spite of the variability among samples at
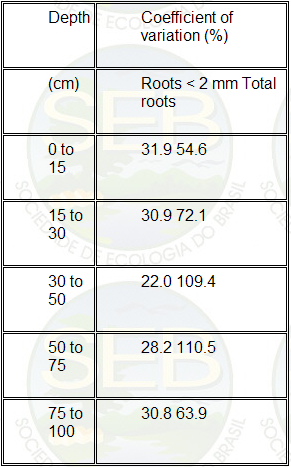
the same depth. The high variability was due principally
to the variability in the distribution of thick roots,
whereas the medium and fine classes showed a much more
homogeneous distribution among samples (Table 4).
Table 4 Coefficient of variation (%) of root mass for
the classes "very fine + fine" (diameter <
2mm) and total roots in soil blocks sampled at each depth
Integrating the curve in Figure 1, the
total root biomass in the interval from 15 to 620cm depths
was estimated. For the superficial layer, from 0 to 15cm
depth, the average biomass of the 16 soil blocks was used,
giving a value of 14460kg. ha-1. Thus the total belowground
biomass (living and dead), not including charcoal, was
estimated at 33,370 kg.ha-1 to a depth of 620cm.
Figure 1. Total root biomass (dependent variable) as
a function of soil depth (independent variable) measured
in soil blocks.
The size class distribution of the roots
to 100 cm depth is shown in Figure 2, with a marked concentration
of roots in the superficial 0-15cm layer where the biomass
was 2.2 times that of the next depth (15-30cm). The estimates
from the soil blocks indicated that, to 620cm depth, 70%
of the biomass was found in the 0-50cm layer and 80% in
the first 100cm depth. The rhizomes of grasses made up
5.9% of the total biomass of the 0-15cm layer and only
0.2% in the subsequent depth (15-30cm).
Figure 2. Distribution of root diameter classes as a
function of depth in the first 100cm, measured in soil
blocks. Very fine = material collected by washing/floating
sieved soil samples; fine = diameter < 2 mm; medium
= diameter 2-10 mm; thick = diameter > 10 mm.
There was an increase in the percentage of biomass in
thick roots as depth increased from the soil surface to
40-50cm (Figure 3), with a concomitant decrease in the
contribution of very fine and fine roots. Up to a depth
of 100cm, 29% of the root biomass was classified as very
fine, 30% as fine, 13% as medium and 25% as thick, with
the grass rhizomes representing 3%.
Figure 3. Percentage of total root biomass in each diameter
class as a function of depth from the surface to 100cm,
measured in soil blocks. Very fine = material collected
by washing/floating sieved soil samples; fine = diameter
< 2mm; medium = diameter 2-10mm; thick = diameter >
10mm.
Thick roots were not encountered in our
samples at depths below 100cm from the soil surface, although
the medium size class was present in samples to a depth
of 420cm, representing 40% of the total biomass in the
range of 100 to 620cm depths. The percentage of very fine
roots within the class of very fine + fine was fairly
constant at all depths, with values between 55 and 65%,
with the exception of the surface 0-15cm layer, in which
the very fine roots made up 44% of the total.
The two areas of 100m2 sampled as tanks
had total basal areas of 1970cm2 and 2380cm2, for individuals
with circumference greater than 30cm at 30cm, and 160kg
and 212kg of dry weight of root crowns, respectively.
Using the equation of Abdala (1), which correlates the
dry weight of the root crowns (kg), with the basal area
(cm2), the estimates of root crown biomass for the two
areas were 154kg and 188kg. These estimates were respectively
3.2% and 11.1% smaller than the actual weights obtained
from the field samples, a tolerable limit, which permits
the application of the regression equation to other areas.
Thus for the average basal area of 10.2cm2 m-2 for individuals
with circumference equal to or greater than 30cm at 30cm
height, a total belowground biomass for the root crowns
of 7,800kg.ha-1 was estimated.
Fragments of charcoal were frequently
present in sample blocks to a depth of 200cm, with dry
weight 9 to 10 times that of the roots in some samples.
These fragments, with volumes no greater than about 1cm3,
appeared generally after washing of the samples. The average
weights are low but a clear tendency was seen with a peak
in the surface layer (0-15cm) and another at 100cm depth
(Figure 4a). The importance of the charcoal as a fraction
of the total biomass increased at depths of 100 and 210cm
(Figure 4b). With a minimum value of 0.05mg of charcoal
per cm3 of soil in the range of 120 to 200cm depth, added
to the values obtained for the more superficial layers,
a total of 1980kg.ha-1 of charcoal can be estimated in
the soil from 0-220cm depth.
Figure 4 Distribution of charcoal as a function of depth
to 200cm. a) Average dry weight per unit soil volume.
b) Charcoal as a percentage of total belowground biomass.
Organic Matter in the Soil
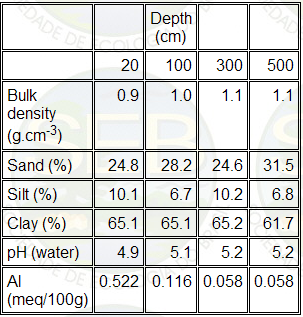
Classified as a dark-red latosol, the
soil was yellowish-red (5 YR 4/6) to a depth of 40cm and
red (2.5 YR 4/8) from 40 to ca. 500cm. Whitish particles
and small fragments of dark colored rocks were visible
from 500cm on down, with regolith at 600 to 650cm depths.
The soil analysis showed results (Table 5) typical for
cerrado soils (14).
The percentage of organic carbon in the
soil as a function of depth fit a log-log regression (Figure
5), with a correlation coefficient of r = 0.95 (P<<0.001).
Considering an average value of 0.94g.cm-3
for the apparent density of the soil to a depth of 100cm,
gradually increasing to 0.99g,cm-3 at 300cm and to
1.14g.cm-3 at 400cm, then constant to
620cm, the total organic matter in the soil was estimated
at 642,300kg.ha-1 to a depth of 620cm, based on the curve
of Figure 5 (15 to 620cm depth),
Table 5. Some features of the soil under the cerrado
sense strict studied.
The average value of 2.15% organic carbon
obtained from the analyses of the soil blocks was used
for the 0-15cm layer and the conversion factor of 1.724
to transform organic carbon to organic matter in all calculations.
The first 50cm of soil contained only 21% of the soil
organic matter and the first 100cm contained 32% of the
total, with a large fraction encountered at greater depths.
Figure 5. Percentage of organic carbon (dependent variable)
in the soil is a function of depth (independent variable).
A summary of the distribution of organic material in
the cerrado is presented in Figure 6. The total belowground
biomass, excluding charcoal and soil organic matter, divided
by the total aboveground biomass, including litter, presents
a ratio very close to 1.
Figure 6. Stocks of biomass in different compartments
of the cerrado sense strict. Aboveground biomass includes
standing dead. Root diameter classes are as follows: Very
fine = material collected by washing/floating sieved soil
samples; fine = diameter < 2 mm; medium = diameter
2-10 mm; thick = diameter > 10 mm. Rhizomes of grasses
were included in the class of medium size roots. Humus
refers to soil organic matter.
DISCUSSION
The large percentage of individuals of
the woody layer in the first stem circumference class
(over 60%) is common in the cerrado (40). It is can be
explained by the occurrence of fire, at intervals of not
more than 3-4 years, as well as the genetic potential
of many species, which occur only as small individuals.
The literature (40) cites that found a non-balanced statistical
structure in the stem diameters of the cerrado on the
Experimental Station at Paraopeba, Minas Gerais State,
Brazil, explaining this as due to selective cutting. In
our cerrado, fire and selective cutting explain the imbalance,
although the backward "J" of the circumference
classes shows a tendency to equilibrium, typical of non-planted
forests.
The phytosociological analysis of the
woody layer shows a pattern very common in the cerrado
of the Brasília, Federal District in terms of dominant
species (15). The only difference is the dominance of
Caryocar brasiliensis, which, although important, is not
usually dominant as in our area. Perhaps, this is due
to the conservation of Caryocar when firewood is collected
because of its fruit, much appreciated in this region.
The estimate of 2450g.m-2 (24,520kg.ha-1)
of the wood component of the woody-layer biomass in our
area is slightly more than the average (39), which was
2025.g.m-2. Other study (37) reported values from 1,180
to 3,670g. m-2, with an average of 2,260g.m-2, in 38 plots
of 10 x 10m each of typical cerrado. This variability
can be explained by the high spatial heterogeneity of
aerial biomass per unit area commonly observed in savanna
areas in what is essentially the same stand (12, 33).
Compared with other savanna, types the aerial woody biomass
of our cerrado approximates that of the Andropogonae open
shrub Savannah of the Ivory Coast, 2,190g.m-2 (26). Although
this has larger trees and fewer shrubs, and is more than
that of the Nylsvley Savanna of South Africa, 1,490g.
m-2 (33).
The 12% of the total aerial biomass of
woody plants of 6C30 or more (trees plus thicker-stemmed
shrubs) that is in the shrub class alone are closed to
the 11.5%, in the Nylsvley Savanna (33). He included all
individuals with diameter greater than 1cm at 20cm above
the ground and considered individuals with heights of
less than 2.5m as part of the
shrub layer. In Nylsvley the standing
dead woody biomass was 11.5% of the total biomass of trees
and live scrub including leaves, found 7% of the biomass
in standing dead in a cerrado sense strict (39). In the
present study the small percentage of standing dead biomass
(1.1%) is probably due to the selective harvesting of
firewood in the area.
In the ground layer, the total of 1,080g.m-2
(including litter) is closed to the value of 990g.m-2,
in a cerrado close to Brasília, DF (18). These
authors estimated the ground layer biomass excluding litter
at 455g.m-2 with grasses representing 62%. In the present
study, 74% of the ground layer biomass excluding litter
was composed of grasses. Other studies in areas of cerrado
in Brasília, DF. showed proportions of grasses
ranging from 50 to 80% (4, 37), depending on variations
in the density of tree cover, sampling season and time
after fire. In the Lamto Savanna of the Ivory Coast, 79%
of the ground layer biomass corresponded to grasses (22),
whereas in Trachypogon savannas in Venezuela, the grasses
comprise 80 to 100% of the total aboveground biomass (36).
The high concentration of the roots in
the superficial layers of the cerrado soil is in accordance
with observations in other tropical ecosystems (7, 26,
38, 42). However, the percentage of total root biomass
in these layers depends on the total depth sampled. For
example, if it considers only the first 100cm in the present
study, the root biomass in the first 30cm is 75% of the
total, instead of the value of 60% obtained for the whole
profile to 620cm depth. In studies of nutrient sources,
sinks and losses, the relative contribution of a soil
layer was assumed to be in some degree proportional to
its fine root density.
This assumption, plus the difficulty
in sampling greater depths, has led to an emphasis on
upper soil layers, usually to depths of less than 100cm,
in most studies, despite the evidence showing the importance
of deep roots in water uptake (41).
The total volume of the soil blocks collected
at depths beyond 100cm in the cerrado is probably insufficient
to adequately estimate the thick roots, whose distribution
is very heterogeneous, but which could be seen, albeit
infrequently, in the eroded walls of the gully at depths
beyond 400cm. For this reason, the belowground biomass
calculated from the equation of Figure 1 underestimates
the roots with diameter greater than 10mm. The biomass
contributed by this fraction, which does not appear in
the equation, should be relatively small, due to the large
concentration of roots, including thick roots, in the
superficial layers of the soil. Similar conclusions as
regards the inadequate number of samples for determining
thick roots at greater depths were reached (42).
The total root biomass decreases exponentially
with depth in many different ecosystems, however, in certain
savannas there is an increase in the root biomass from
the surface to a depth of 20-30cm, consistent with the
hypothesis in which the stability of the savannas is due
to two strata (44). And that trees and herbs of these
two strata explore different soil horizons. The gradual
increase in the proportion of thick roots as we proceed
from the surface to a depth of c. 50cm (Figure 3) demonstrates
the competitive interaction between trees and herbs in
the cerrado, in accordance with the two-layer hypothesis
(44), or with the models of Savanna structure (43).
This pattern has been observed in other
savannas (21, 23, 31, 34). Sampling in more detail, with
soil layers of only 10cm thickness, for example, should
permit a more precise description of the distribution
of woody roots along the soil profile in the cerrado.
The proportion of fine plus very fine
roots, with diameters less than 2mm, is high in the cerrado,
compared to other ecosystems, principally forests.
This difference may be due to the presence
of a continuous ground layer in the cerrado with a high
proportion of non-woody plants. The vegetation of Accra
Plains, consisting of small thicket clumps associated
with mounds surrounded by grassland, shows a high percentage
of fine root (31).
The other authors (6) showed that the
proportion of fine roots (diameter<6mm) increased from
60% to 90% when the percentage of non-woody plants went
from 1% to 44% of total biomass in the faces Tall Bana
and Open Bana woodland, respectively.
The part of this difference founds in
the cerrado may be explained by the method of extraction
of the very fine roots by floating in water. This process
permits the recovery of very fine roots and root fragments,
which would not be harvested by manual separation or sieving
of roots from soil samples. This component was a significant
fraction of the belowground biomass: 35% of the total
belowground biomass, and 60% of the roots with less than
2mm in diameter.
When the belowground biomass of different
ecosystems is compared, without considering the differences
in methodologies used, a large variation is noted in the
order of magnitude of the total root weight (Table 6),
as well as in the root/shoot ratio. The majority of perennial
herbaceous species, including some grasses, present well
developed root systems, with a root/shoot ratio generally
greater than 1.0 (26, 45).
Woody plants in their initial growth
stages also present a root/shoot ratio greater than 1.0;
however, as the plant grows, there is a tendency to invert
this ratio (34, 45). Water stresses, whether from flooding
or from deficits, can lead to an increased investment
in the root system (5, 6, 29, 41). Nutritional stress
can lead to a similar modification in the relative development
of root and shoot (5, 20, 41) and fire-adapted communities
also tend to invest heavily in belowground structures
(5, 45).
In the cerrado sense strict studied,
with its high density of shrubs, water stress, nutritional
stress and fire adaptation are all-present as probable
factors leading to increased root/shoot ratio. The root/shoot
ratio of 1 can be considered relatively high, compared
to other Savanna ecosystems, such as the Andropogonae
savanna woodland (r:s = 0.6) (26), and even when compared
to dry forests with a total biomass greater than that
of the cerrado.
Some authors (6) showed an inverse relation
between the aboveground biomass and the root/shoot ratio
along a topographic gradient in Low Amazon Caatinga, that
is, the root/shoot ratio increased as the proportion of
woody plants, in the total biomass decreased, as would
be expected. This pattern was also observed by other authors
in the Tall Amazon Caatinga (20), and in the Andropogonae
savannas of the Ivory Coast (26). For the cerrado sense
lato, with its varying densities of woody plants in diverse
physiognomies, one would expect a similar relationship,
in which the root/shoot ratio decreases as the total aboveground
biomass increases.
Table 6. Comparison of belowground or root biomass (R),
total biomass (R + S) and the ratio root/shoot (R/S) in
different tropical ecosystems.
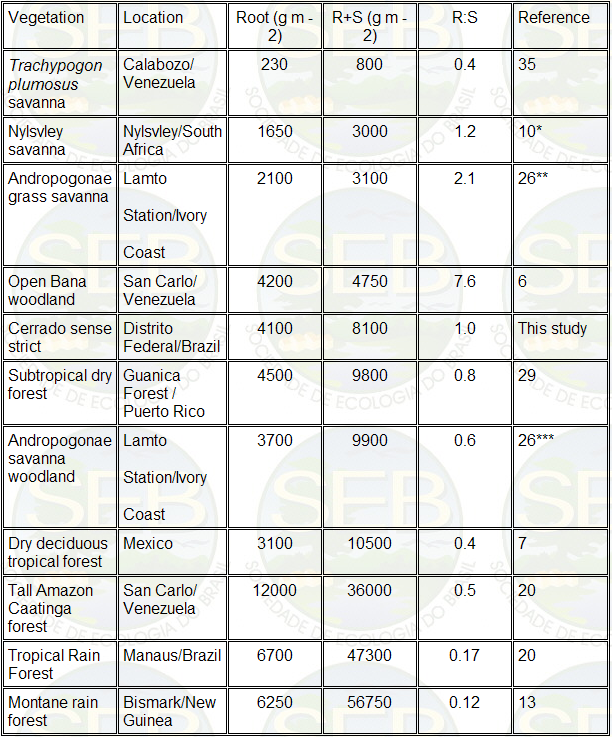
* Average of open and sub-canopy areas, where the canopy
cover amounted to 27.5%.
** Above and belowground peak total biomass.
*** The sum of above + belowground / herbaceous + woody
/ mean biomass.
References to the quantities of charcoal
present in soil have not been found, even in studies in
which the areas suffer frequent burning. Although the
charcoal represented less than 3% of the total biomass
of the roots, its presence in practically 90% of the soil
blocks sampled to a 200cm depths, And the increased proportion
of charcoal to total belowground biomass with increasing
depth (Figure 4b). It indicates that this material is
highly resistant to decomposition. The charcoal fragments
were frequently encountered in all the samples of a certain
depths, 100 a
120cm, for example, and were very rare
in the samples at other depths, such as 50 to 75cm.
The soil organic carbon content encountered
in the present study is very similar to that reported
in the superficial layers of the soil in other cerrado
area (14). Compared with other ecosystems, the percentage
of organic matter is relatively low; even so, when the
organic matter in the soil is included in the total above
and belowground biomass. Its can verify that the belowground
compartment contains 94% of the total carbon stock in
the cerrado (Figure 7), based on calculations to a depth
of 620cm. With a ratio between organic carbon/organic
matter equal to 0.58, the stock of organic carbon in the
first 100cm of the soil would be 11.9kg. m-2. This value
is comparable to that of other tropical oxisols (25).
The total area of cerrado on latosol
has been estimated as 92 million hectares (16). Using
the formula from Figure 5 to estimate the organic carbon
to 2m, a total of 16.3.1015g of organic carbon would be
present in the cerrado latosol. This value represents
33% of the total organic carbon estimated for all the
savannas around the world (3). This proportion would be
much higher if the total depth of the latosol, which often
reaches 10 to 20m, were considered.
Figure 7. Percentage of total biomass in the cerrado:
distribution between the aboveground and belowground compartments,
in which the overwhelming contribution of soil organic
carbon is evident.
ACKNOWLEDGMENTS
We are grateful to Washington Novaes,
former Director of SEMATEC. Francisco Ozanan C. C. de
Alencar, head of the Department of Parquets and Gardens
of the Brasília Federal District, Rogério
Pereira Dias, Oscar A.M. Rosa Filho, Márcio Armando
Silveira, Mardocheu P. Rocha, Mara R. B. Chaves and Pedro
Caldas, as well as the team of excavators from NOVACAP,
for their support.
--------------------------------------------------------------------------------
RESUMO
Matéria orgânica e raizes
da superfície e do solo: relação
das raizes com os demais componentes da matéria
orgânica do cerrado do Brasil Central.
A biomassa aérea e subterrânea
e o carbono orgânico do solo foram medidos até
a profundidade de 6m em um cerrado típico (sense
strict) próximo a Brasília, DF, Brasil,
sobre um latossolo vermelho escuro, bem drenado (Haplutox).
Um levantamento fitossociológico de espécies
lenhosas e da camada rasteira foi conduzido. Um total
de 3.300 árvores e arbustos por hectare foram encontradas,
com uma área basal total de 14,5m2.ha-1, volume
cilíndrico de 68,4m 3 .ha-1, e biomassa aérea
de 26.020kg.ha-1. A camada rasteira apresentou uma biomassa
aérea média de 5.580kg.ha-1 (4.130kg.ha-1gramíneas
e 1.450kg.ha-1 não-gramíneas). A serapilheira
foi estimada em 5.190kg.ha-1 e a biomassa subterrânea
em 41.100 kg. ha-1, com coroas de raiz contribuindo com
7.800kg.ha-1, e carvão com mais 1.980kg.ha-1. A
matéria orgânica do solo, até 620cm
profundidade, foi 642.000kg.ha-1, representando 89% do
total, excluindo o carvão (724.400kg.ha-1).
Palavras chaves: biomassa; carvão;
ciclo global de carbono; savana; carbono orgânico
do solo
--------------------------------------------------------------------------------
REFERENCES
Abdala, G.C. Análise energética
de um cerrado e sua exploração por atividade
de carvoejamento rústico. Brasília, DF,
1993, 105 p. (MSc. Thesis, Department of Ecologia, Universidade
de Brasília, DF.).
Allison. L.E. Organic carbon. In: Black, C. A. (ed.).
Methods of Soil Analysis. Part II. Chemical and microbiological
properties. American Society of Agronomy, Madison, WI,
1965, p. 1367-1378.
Anderson, J.M. Responses of soils to climate change. Advances
in Ecological Research, 22: 163-210, 1992.
Batmanian, G.J., Haridasan, M. Primary
production and accumulation of nutrients by the ground
layer community of cerrado vegetation of central Brazil.
Plant and Soil, 88: 437-440, 1985.
Bloom, A.J.; Chapin, F.S.; Mooney, H.A. Resource limitation
in plants - an economic analogy. Annual Review of Ecology
and Systematic, 16: 363-392, 1985.
Bongers, F.; Engelen, D.; Klinge, H. Phytomass structure
of natural plant communities on spodosols in southern
Venezuela: the Bana woodland. Vegetatio, 63: 13-34, 1985.
Castellanos, J.; Maass, M.; Kummerow, J. Root biomass
of a dry deciduous tropical forest in Mexico. Plant and
Soil, 131: 225-228, 1991.
Coutinho, L.M. Fire in the ecology of Brazilian Cerrado.
In: Goldammer, J.G. (ed.). Fire in the Tropical Biota.
Springer-Verlag, Berlin, 1990, p. 82-105.
Cox, G.W. Laboratory Manual of General Ecology. 5th ed.
Wm.C. Brown Company Publishers, Duboque, Iowa, 1985, 248
p.
Cresswell, C.F.; Ferrar, P.; Grunow,
J.O.; Grossman, D.; Rutherford, M.C.; van Wyk, J.J.P.
(1982) Phytomass, seasonal phenology and photosynthetic
studies. In: Huntley, B.J.; Walker, B.H. (ed.). Ecology
of Tropical Savannas. Springer-Verlag, Berlin, 1982, p.
476-497.
Curtis, J.T.; McIntosh, R.P. Upland forest continuum in
the prairie-forest border region of Wisconsin. Ecology,
32: 476-496, 1951.
Eiten, G. The cerrado vegetation of Brazil. Botanical
Review, 38: 201-341, 1972.
Edwards, P.J.; Grubb, P.J. Studies of mineral cycling
in a montane rain forest in New Guinea. I. The distribution
of organic matter in the vegetation and soil. Journal
of Ecology, 65: 943-969, 1977.
EMBRAPA. Levantamento de reconhecimento dos solos do Distrito
Federal. Boletim Técnico, SNLCS, No. 53, Rio de
Janeiro, 1978, 455 p.
Felfili, J.M.; Silva Jr., M.C. A comparative study of
cerrado (sense strict) vegetation in Central Brazil. Journal
of Tropical Ecology, 9: 277-289, 1993.
Goedert, W.J. Solos dos Cerrados: tecnologias e estratégias
de manejo. Embrapa-Nobel, Brasília, 1987, 422 p.
Haridasan, M. Solos. In: Pinto, M.N. (ed.). Cerrado: Caracterização,
Ocupação e Perspectivas. SEMATEC/EDUNB,
Brasília, 1994, p. 321-344.
Kauffman, J.B.; Cummings, D.L.; Ward, D.E. Relationships
of fire, biomass and nutrient dynamics along a vegetation
gradient in the Brazilian cerrado. Journal of Ecology,
82: 519-531, 1994.
Klinge, H.; Herrera, R. Biomass studies in Amazon Caatinga
forest in Southern Venezuela. 1. Standing crop of composite
root mass in selected stands. Tropical Ecology, 19: 93-110,
1978.
Klinge, H.; Herrera, R. Phytomass structure of natural
plant communities on spodosols in southern Venezuela:
the tall Amazon Caatinga forest. Vegetatio, 53: 65-84,
1983.
Knoop, W.T.; Walker, B.H. Interactions of woody and herbaceous
vegetation in a southern African savanna. Journal of Ecology,
73: 235-253, 1985.
Lamotte, M. The structure and function of a tropical Savanna
ecosystem. In: Golley, F.B.; Medina, E. (ed.). Tropical
Ecological Systems: Trends in Terrestrial and Aquatic
Research. Springer-Verlag, Berlin, 1975, p. 179-222.
Lawson, G.W.; Jeník, J.; Armstrong-Mensah, K.O.
A study of a vegetation catena in Guinea savanna at Mole
Game Reserve (Ghana). Journal of Ecology, 56: 505-522,
1968.
Lopes, A.S.; Cox, F.R. Cerrado vegetation in Brazil: an
edaphic gradient. Agronomy Journal, 69: 828-831, 1977.
Lugo, A.E.; Brown, S. Management of tropical soils as
sinks and sources of atmospheric carbon. Plant and Soil,
149: 27-41, 1993.
Menaut, J.C.; Cesar, J. The structure and dynamics of
a West African savanna. In: Huntley, B.J.; Walker, B.H.
(ed.). Ecology of Tropical Savannas. Springer-Verlag,
Berlin, 1982, p. 80-100.
Meyer, H.A. Structure, growth and drain in balanced uneven-aged
forests. Journal of Forestry, 50: 85-92, 1952.
Miranda, A.C.; Miranda, H.S. Estresse hídrico.
In: Dias, B.F.S. (ed.). Alternativas de desenvolvimento
dos Cerrados: manejo e conservação dos recursos
naturais renováveis. Funatura, Brasília,
1992, p. 28-32.
Murphy, P.G.; Lugo, A.E. Structure and biomass of a subtropical
dry forest in Puerto Rico. Biotropica, 18: 89-96, 1986.
Nepstad, D.C.; Carvalho, C.R.; Davidson, E.A.; Jipp, P.H.;
Lefebvre, P.A.; Negreiros, G.H.; Silva, E.D.; Stone, T.A.;
Trumbore, S.E.; Vieira, S. The role of deep roots in the
hydrological and carbon cycles of Amazonian forests. Nature,
372: 666-669, 1994.
Okali, D.U.U.; Hall, J.B.; Lawson, G.W. Root distribution
under a thicket clump on the Accra Plains, Ghana: Its
relevance to clump localization and water relations. Journal
of Ecology, 61: 439-454, 1973.
Rizzini, C.T.; Heringer, H.P. Underground organs of trees
and shrubs from southern Brazilian savannas. Anais da
Academia Brasileira de Ciências, 34: 235-247, 1962.
Rutherford, M.C. Woody plants biomass in Burkea africana
savannas. In: Huntley, B.J.; Walker, B.H. (ed.). Ecology
of Tropical Savannas. Springer-Verlag, Berlin, 1982, p.
120-141.
Rutherford, M.C. Growth rates, biomass
and distribution of selected woody plant roots in Burkea
africana-Ochna pulchra savanna. Vegetatio, 52: 45-63,
1983.
San José, J.J.; Medina, E. Organic matter production
in the Trachypogon savanna at Calabozo, Venezuela. Tropical
Ecology, 17: 113-124, 1976.
San José, J. J.; Montes, R.; Garcia-Miragaya, J.;
Orihuela, B. E. Bio-production of Trachypogon savannas
in latitudinal cross-section of the Orinoco Llanos, Venezuela.
Acta Oecologica, Oecologia Generallis, 6: 25-43, 1985.
Santos, J. R. Biomassa aérea da vegetação
de cerrado: estimativa e correlação com
dados do sensor "Thematic Mapper" does satélite
Landsat. Curitiba, Paraná, 1988. (Doctoral Thesis,
Universidade Federal de Paraná, Curitiba, PA.,
Brazil).
Sarmiento, G. The Ecology of Neotropical Savannas. Harvard
University Press, Cambridge, Massachusetts, 1984, 235
p.
Silva, F. C. Compartilhamento de nutrientes em diferentes
componentes da biomassa aérea em espécies
arbóreas de um cerrado. Brasília, DF, 1990,
80 p. (MSc. Thesis, Department of Ecologia, University
of Brasília, Brasilia, DF., Brazil).
Silva Jr., M.C.; Silva, A.F. Distribuição
dos diâmetros dos troncos das espécies mais
importantes do cerrado na Estação Florestal
de Experimentação de Paraopeba (EFLEX)-MG.
Acta Botanica Brasilica, 2: 107-126, 1988.
Stone, E.L.; Kalisz, P.J. On the maximum extent of tree
roots. Forest Ecology and Management, 46: 59-102, 1991.
Vance, E.D.; Nadkarni, N.M. Root biomass distribution
in a moist tropical montane forest. Plant and Soil, 142:
31-39, 1992.
Walker, B.H.; Noy-Meir, I. Aspects of stability and resilience
of savanna ecosystems. In: Huntley, B.J.; Walker, B.H.
(ed.). Ecology of Tropical Savannas. Springer-Verlag,
Berlin, 1982, p. 556-590.
Walter, H. Ecology of Tropical and Subtropical Vegetation.
Oliver & Boyd, Edinburgh, 1971.
Whittaker, R.H.; Marks, P.L. Methods of assessing terrestrial
productivity. In: Lieth, H.; Whittaker, R.H. (ed.). Primary
Productivity of the Biosphere. Springer-Verlag, New York,
1975, p. 55-118.
